As a meteorologist, it is difficult for me to turn that part of myself off wherever I go. When people try to make small talk about the weather with me, they usually regret it, because to me weather isn’t just to pass the time, but it’s interesting. However, for most people it is small talk. Invariably whenever I go out in public I overhear conversations about the weather, whether in restaurants, museums, the locker room at the gym, etc. There is a common theme I hear which is that forecasters don’t know what’s going on. I hear and read things like prediction is not even possible. I have had people come up to me and jokingly say, “Meteorology must be a great profession because you can be wrong 50% of the time and still have a job.” Though they clearly are telling one of those jokes that they actually believe to be true, the chuckle I give in return is not nearly as sincere. To explain would require more time than I often have, so I thought maybe I should write a post explaining some of the basics, and explain some of the most common things people misunderstand about the weather.
Why Forecast?
There is a lot to the history of forecasting, but I think it’s fairly clear why people want to have some knowledge about what sort of weather was coming their way. Whether you wanted to know when to plant crops, went to harvest, or where and when to sail your ship, having knowledge of the atmosphere, knowing what weather is coming your way has huge advantages. The beginnings of forecasting as a science were driven by WWI when aviation was added to warfare and they quickly realized that having weather observations and an ability to know what weather was coming was a huge tactical advantage. The weather forecast is something almost everyone utilizes today, whether you think it means something or not, people will still look to try to make the best guess about what to wear, whether to bring an umbrella, or whether travel or not will be hazardous.
How Accurate are Forecasts and Why Do People Think They Are Not Accurate?
First things first. Currently the National Whether Service is accurate for 1 and 2 day temperature forecasts to within 2.5 – 4 F, and has an 82% accuracy rate when it comes to precipitation. I am not going to spend a lot of time proving accuracy here, you can check out these links as they have already done the work.
What I will say is that it is important to understand how our cognitive biases shape our perception. The one at work here is that what sticks in memory are the misses, and not the hits. When the forecast is right, you don’t think about the forecast. When it’s wrong you do. This creates a data point in your brain only when there is a missed forecast, but it’s poor way to draw meaningful statistical conclusions. I think it’s also important to note that I see a lot of click bait type headlines for upcoming weather and this may be what’s drawing our attention. Extreme gets clicks, but may not be what’s being endorsed by the National Weather Service. It’s also not clear whether people are staying current with the latest forecast.
Finally I think it’s important to remember that in extreme weather situations forecasters will err on the side of caution. It is a difficult line to walk. When extreme predictions don’t happen, the public loses trust in your forecast, and this can cost you lives in the future. If on the other hand you don’t communicate the possibility of an extreme situation, that can also lose you lives. So in erring on the side of caution, more often than not people will find that it might not have been quite as bad as predicted. Erring on the side of caution is the right thing to do, because there is an inherent error to the forecast. Sometimes in the margin of error, the extreme end of that error can be the difference between life and death.
Hard Rain
Precipitation is the hardest variable to forecast for and some of the reasons for that are given in the next section, but a few points are worth talking about here. First, many people don’t understand the precipitation forecast. This has been a criticism of the National Weather Service to change their way of forecasting precipitation, but for now, there seems to be no better way of doing it. When the probability of precipitation (PoP) is reported, it is reported as a percent. But what does that percent mean? This probability is actually the product of two other numbers. One is the actually chance of precipitation but the other is the percentage of the forecast area that will be impacted by precipitation. Each National Weather Service office has a specific region in which they are suppose to forecast for and they usually break those down into smaller regions for the purpose of precipitation forecast, but the fact remains that incorporated into that PoP is areal coverage. So 50% chance of precipitation is not the coin toss that some make it out to be, but it could mean that there is a 100% chance of rain over half the forecast area. Of course it could also mean that there is a 50% chance over all the forecast area. But it’s also important to remember that even in the latter case it’s not a coin toss, but rather based on evidence that pegs precipitation as more likely. The difference between rain and no rain can often be very small and requires knowledge of atmospheric properties at high resolution. A far higher resolution than we have.
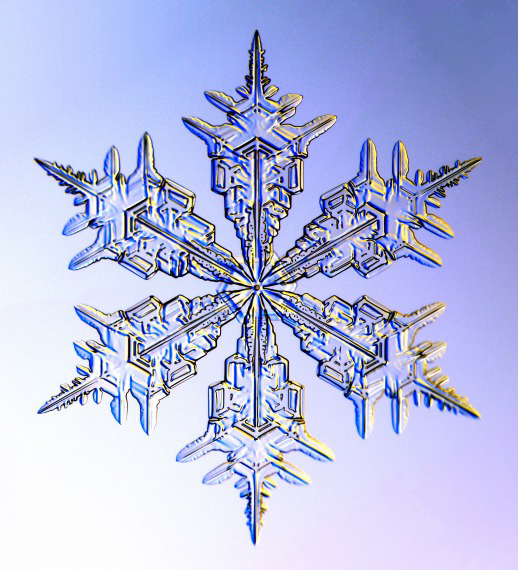
Snow forecasts are often worse, and this is largely due to two factors. One, is that it depends on temperature whether you get rain or snow. It takes a very slight error in the forecasted temperature for rain to suddenly become snow or vice-versa. So being 2 F off in our forecasted temperature may make no difference in what you wear for the day, but it can have huge impacts on what driving conditions are like. The second important factor here is that water expands when it freezes such that the ratio of snow to liquid precipitation is 10:1. Forecast models only determine the precipitable water for a particular area. If that prediction is off by 0.2 inches this could be the difference between 1 and 3 inches of snow, which is a rather big deal when it comes to driving. But it’s not always a matter of the forecast model being wrong in terms of precipitable water. Across any storm system there is going to be variation in the amount of precipitable water and thus getting the storm track exactly right also matters. Mix this in with a possible slight error in forecast temperature can lead to a vast difference the amount of snow accumulation for a particular location. On top of that the 10:1 ratio is more like 7:1 if the snow is really wet, so this adds error into the forecast as well.
Weather is a matter of Scale
 A lot get’s said about the difference between weather and climate, but very little is said about differences among various types of weather systems. Typically, the average meteorologist separates scale into 3 categories. Turbulent eddies near the surface to convection currents in clouds make up the microscale (< a few km) A thunderstorm or a system of thunderstorms or series of cloud bands for lake effect snow would be part of the mesoscale (about 10-100 km, several hours), and then things like low pressure systems would be on the synoptic scale (about 1000 km, several days). Our ability to forecast events along these scales depends largely on our ability to make observations smaller than the scale we are trying to predict in both space and time. For instance if I am at a station 100 km away from the nearest station, even if I make continuous observation a thunderstorm that happens somewhere in between will not be observed by me. When you look at the number of tornadoes in the U.S. over a 100 year period, you will see a dramatic rise in the number from a few hundred to over a 1000. This is no climate change phenomena, but a matter of our ability to observe tornadoes, and the advent of a national radar network that dramatically increased our ability to determine where tornado producing storms were. Similarly if I make observations only two times a day, I’m unlikely to be able to resolve well the changes that occur between those observation times.
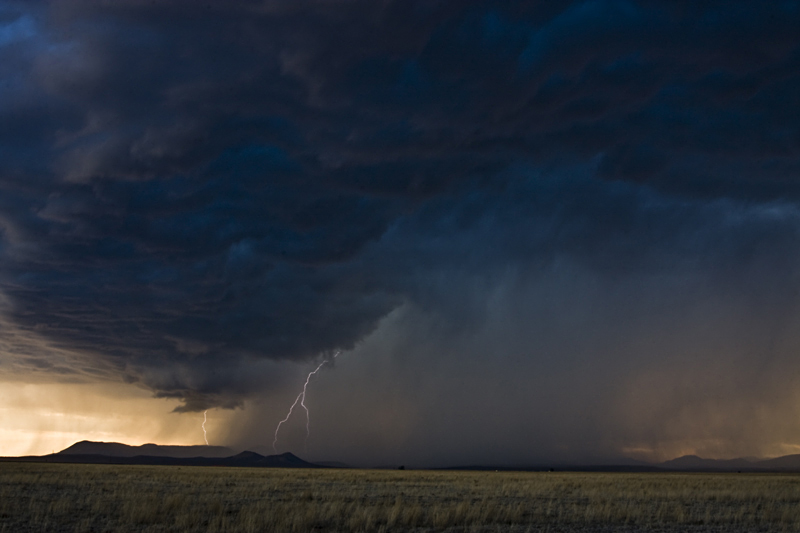
Computer models that forecast weather have similar problems. Computer models operate by breaking up the atmosphere into a 3-D grid that then processes the physical equations that describe the atmosphere at equal time intervals. The size of these grids and the spacing of the measurement network that gives the initial data for these models to work lends itself best to the forecasting on the synoptic scale. What this means is that we are likely to best forecast the development and movement of low pressure systems and high pressure systems, and forecast widespread rain. The timing and movement of individual thunderstorms represent processes that occur at the sub-grid level. In essence, noise. Obviously a potential hail or tornado producing thunderstorm is not really noise, but this is why your forecaster is pretty good at telling you when that cold front is coming through the next day, but not so good at pinpointing where thunderstorms will be the strongest. That type of accuracy is usually only made several hours in advance. Although we’re pretty good at assessing a day or two in advance which day will have a high potential for thunderstorms.
Practical vs. Theoretical
When it comes to the theory about how weather works we are, in general, ahead of the game, but practical considerations take precedent. For instance we could do an excellent job of forecasting if we had weather data every 10 km over the surface of the earth and sent up weather balloons once every hours. The cost however of such an enterprise would be enormous. Especially considering it’s very difficult to get this information over the ocean. Remote sensing devices like satellite and radar are making strides in provide better spatial coverage, but even those have limitations. We are never going to have perfect data over as wide a range and as often as we need it, and this is always going to lead to some error. Computer power is also a practical limitation although it has accelerated greatly since the first model. Previously, with all the theory we knew, trying to create a model that matched our data network would have taken the computer so long to produce an output that the time we were trying to forecast for would have been past. This is no longer a terribly relevant problem, but it is if we really want to be able to break into models that compute both synoptic and mesoscale features. It’s a bit hard to explain but you can think of a computer model as potentially like a nesting doll. We could run a model at the smaller scale within in each grid of the synoptic scale model. So a model within a model. That becomes computationally laborious and can take intense amount of computer processing power.

Then we have the reality of cost-benefit analysis. Decisions about weather research and preparedness have a lot to do with what the costs are. This is hardly surprising. If snow is rare in your city you might find that it’s easier for the city to just close down for a day than spend a lot of money on snow plows. As mentioned above, to take ideal amount of measurements would be of great cost and despite the scientist’s love of data, the question must be asked do the gains in forecast accuracy outweigh the costs. Improved technology can help reduce cost and make instruments more maintenance free, but instruments still need to be recalibrated, replaced and maintained. These instruments are outdoors and can get pelted by hail, get dirty, or get spiderwebs or hornets nests, etc. You will find the densest network of measurements in areas where lots of people live. Sparsely populated areas, areas with complex terrain, will have less measurements and this means they will experience greater errors in forecasting. In addition to the complex wind flow that occurs in mountainous areas leading to a large variability in conditions, there are far few weather observing stations. If you live in such a region you are likely less than impressed by your local forecaster.
The Answer is Blowing in the Wind
The prevailing wind direction in mid-latitudes (where most of the U.S. resides) is from west to east. Thus even being downstream of areas that have sparse observing stations also are more poorly forecasted. The best way to know what weather you are about to get is to have good measurements upstream of your location.
Communication Breakdown
Finally, there are also communication issues. The National Weather Service has put a lot of effort into this area, to think how to better communicate and disseminate weather information. For instance if we have a particular graphic showing probabilities for where the eyewall for a hurricane is going to hit, is that graphic communicating what it needs to the person who needs to see it, whether that’s an emergency response worker or the average person?

In this day and age of instant media and social media, it should in some ways make communication easier, but what I’ve noticed that it’s not always clear whether people are paying attention to the most current information, if they’re getting their information from a good source, and even if it seems whether or not they are aware what location a particular forecast is for and may think a forecast was bad even if it wasn’t for where they live. As I mentioned at the beginning there is also a lot of clickbait and alarmist language being used. Things like “bomb cyclone” and other colorful adjectives. At the same time there has been criticism that the normal scientific tendency to temper their language in communicating important information may make people pay less attention to situations they should pay attention to. Undoubtedly there are going to be consequences of both extremes. Overuse of strong language, especially when conditions end up not being that extreme can numb the public to more dire warnings. Trying to find the best way to get people to understand, and pay attention is difficult, but this is a challenge the weather community takes seriously. In the end, there probably is no perfect way to communicate, and it is up to the consumer of the information to educate themselves as well as to what this weather stuff is all about.
Hopefully this little piece helped explain a few things. If you have any other questions, let me know. I’ll add to this so this remains a fixed guide to helping people understanding the challenges in forecasting and why we might have misconceptions about forecasting accuracy.